Familiarizing with the Pipelines UI
On This Page
When you click Pipelines in the Navigation Bar, the Pipelines List View is displayed. In this page, you can view the list of Pipelines created by you or your team, filter the results using Data Controls, and click on any Pipeline to open it in the Detailed View.
The following sections highlight the main elements of the Pipeline List View and the Detailed View:
Pipelines List View
Refer to the image and descriptions below to familiarize yourself with the components of the Pipelines List View.

The following table describes each of these components:
| Page Component | Title | Description |
|---|---|---|
| 1 | Search Bar | Enables you to search for Pipelines using the: - Partial or complete name of the Pipeline. - Source or Destination name or type the Pipeline is created for. - Serial number of the Pipeline. |
| 2 | Data Controls | Enables you to control the data that is displayed. The Data Controls, from left to right are: - Filters: List the Pipelines based on their status, or the name of the Destination to which data is being loaded. - Newest First: Sort and display the Pipelines list based on the criterion selected from the drop-down. By default, the newest Pipelines are displayed first. - Refresh: Allows you to view the newly created Pipelines that are not visible in the UI yet. |
| 3 | + CREATE PIPELINE button | Enables you to create a Pipeline. |
| 4 | Asset List | Displays the list of Pipelines created by you or your team. This list can be refined based on the Data Controls or the search string. |
| 5 | Pipeline Summary | Provides a brief summary of an existing Pipeline. This includes, from left to right: - The Pipeline Priority. This is indicated by an upward arrow. A red arrow indicates a high priority Pipeline. - The sequential serial number assigned to the Pipeline at the time of creation. For example, #3311. - The name of the Pipeline. - The Source from where the data is being fetched. - The status of the Pipeline. A green arrow indicates a running Pipeline, while an orange arrow indicates a paused one. The status can also be gathered from the Pause or Resume icons at the right end. - The Destination where data is being loaded. - Indicators. These are small icons that indicate any issues or failures in Pipeline jobs , Schema Mapper, or Events. |
Pipelines Detailed View
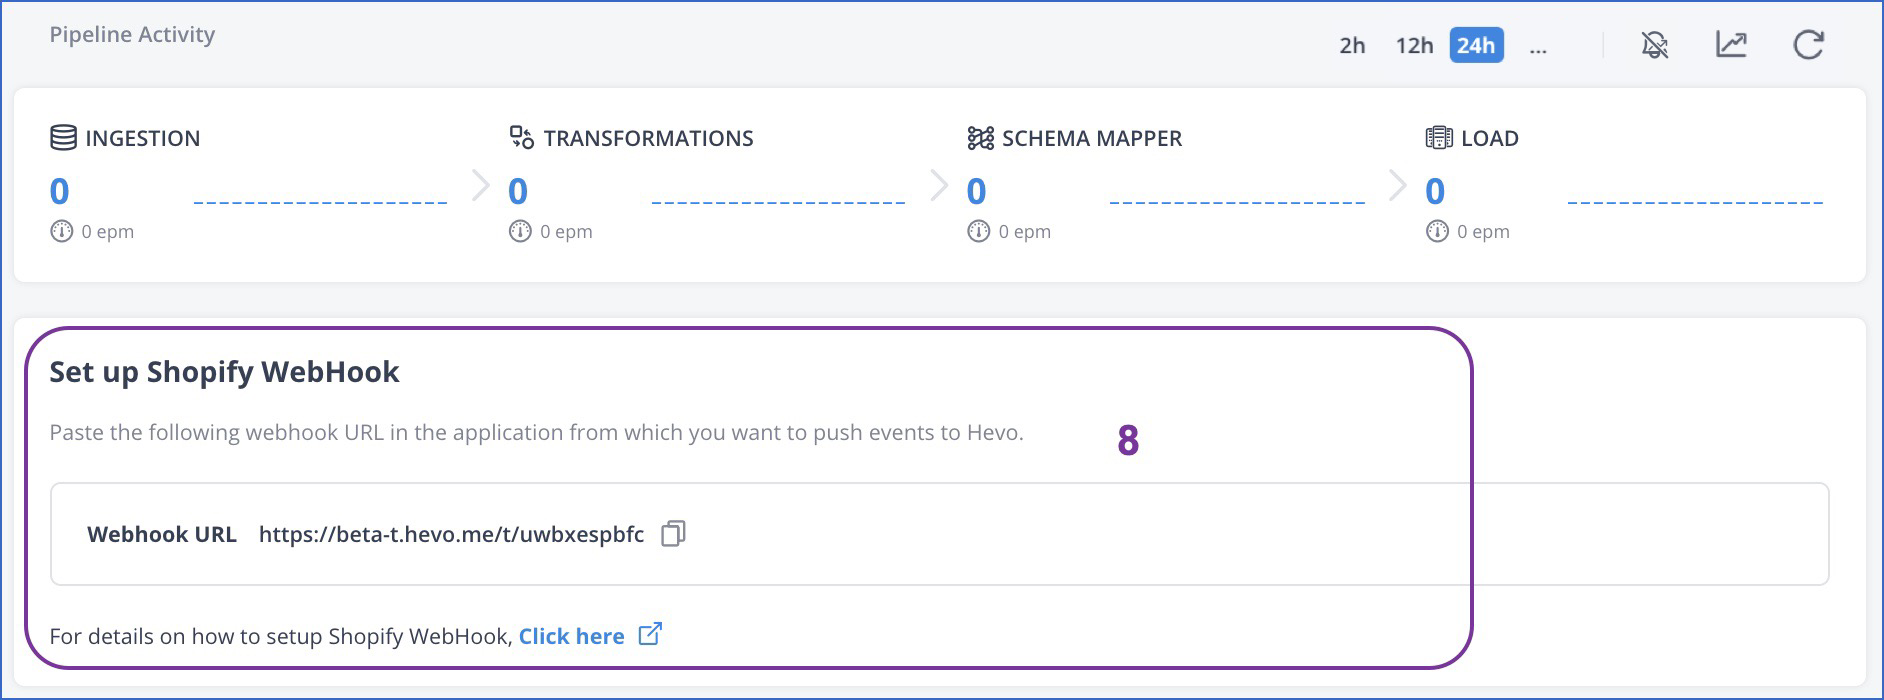
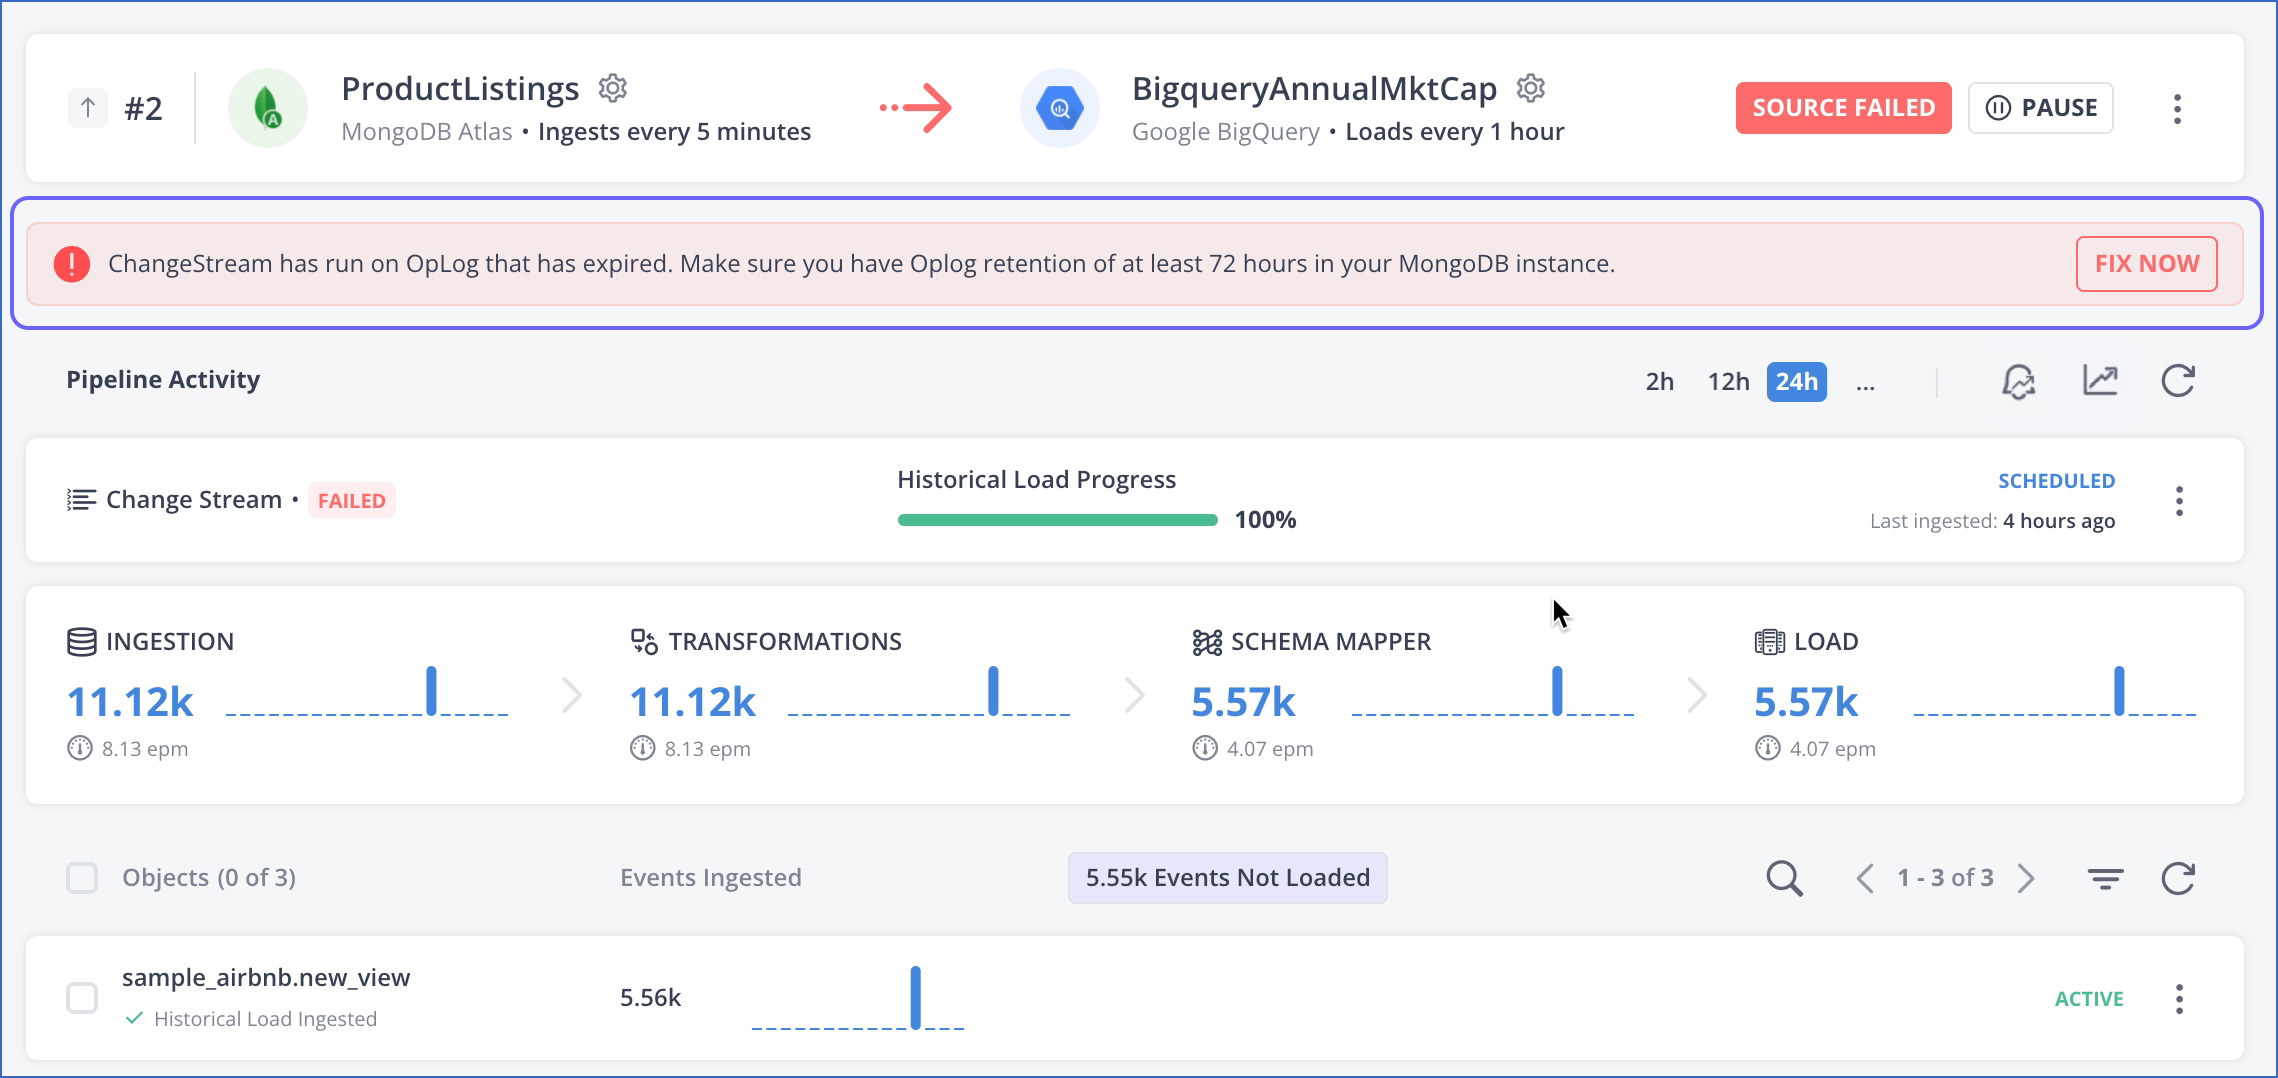
Click anywhere in a Pipeline Summary row to open the Pipeline in the Detailed View. The following image highlights the main components that are displayed and the actions you can perform in the page.
-
Non-webhook Pipelines

-
Webhook Pipelines
The following table describes each of these components:
| Page Component | Title | Description |
|---|---|---|
| 1 | Tools Bar | Provides links for Pipeline Jobs, Overview, Transformations, Schema Mapper, Load Status, and Source Query. |
| 2 | Global Search | Displays your most recent work, such as Pipelines, Models, and Destinations in the left pane, and their key details, available actions, and related documentation on the right. In addition, you can search for and configure any unused Source or Destination from the search results window. |
| 3 | Summary Bar | Displays the: - Pipeline number generated upon Pipeline creation. - Pipeline name and the Source name. - The Destination name and type. - Status label to indicate whether the Pipeline is active or paused. You can click on the More icon to access the actions available for the Pipeline. |
| 4 | Notification Bar | Displays any notification related to the Pipeline, such as, the status of ingestion of Events during the initial data load. |
| 5 | Pipeline Progress Bar | Provides a visual representation of the progress of the data replication process, from ingestion to finally loading the data into the Destination. |
| 6 | Pipeline Activity | Provides a snapshot of the Pipeline activity including the number of Events ingested and loaded, and the latency experienced during this process. It also provides you a quick way to access Pipeline Usage Summary and Data Spike Alerts. Note: For Sources where data refresh is done, the number of Events displayed in the Pipeline Activity section could always be greater than the actual number of Events in your Source. Read Data Refresh. |
| 7 | Pipeline Objects | Displays the objects whose data is ingested from the Source to the Destination. Indicators are displayed for any failed ingestions, schema mappings, and Events. This section is not available for the Pipelines created using the Webhook Sources. |
| 8 | API Details | Provides the Webhook URL using which you can push Events to Hevo based on any activity trigger in your Source account. Note: This section is available only for the Pipelines created using the Webhook Sources and is displayed instead of the Pipeline Objects section. |
Smart Assist
The Smart Assist feature in Hevo is designed to proactively display any error or condition that could affect the data ingestion in your Pipelines. The errors could arise due to limitations imposed by the Source or the way the Pipeline is configured, and may affect the whole Pipeline or individual Source Event Types. The feature is available with both free and paid plans and Trial accounts.
The Smart Assist widget is displayed in the form of a banner at the top in your Hevo UI. It:
- Displays the error or the warning about a potential error or failure,
- Lists the modifications you need to make in your Pipeline, configurations to resolve the error,
- Provides the actions to fix the immediate problem, and also
- Directs you to available documentation that explains the issue in more detail.
Currently, Smart Assist is enabled for the following Sources:
See Also
Revision History
Refer to the following table for the list of key updates made to this page:
| Date | Release | Description of Change |
|---|---|---|
| Aug-26-2024 | 2.27 | Updated section, Pipelines List View to reflect the latest Hevo UI. |
| Jan-15-2024 | 2.19.1 | Updated the screenshots to inclde the Jobs tab in the Tools bar. |
| Apr-10-2023 | 2.11 | Updated section, Pipelines Detailed View to add information about the enhanced search functionality. |
| March-09-2023 | 2.09 | Updated section, Pipelines Detailed View to add information about Hevo displaying the Data Spike Alerts icon in the Pipeline Activity section. |
| Feb-07-2023 | 2.07 | Updated section, Pipelines Detailed View to add information about Hevo displaying the Pipeline Usage Summary icon in the Pipeline Activity section. |
| Feb-21-2022 | 1.82 | Updated section, Pipeline Detailed View with a note in the table about number of Events. |
| Nov-22-2021 | 1.76 | Added the section, Smart Assist. |