Viewing Pipeline Progress
On This Page
Hevo provides you visibility into the data replication activity for your Pipeline via the Pipelines Detailed View. You can view both Pipeline-level and object-level progress via this page.
Viewing Pipeline-level Progress
The information related to data ingestion is displayed in the Pipeline Overview page, while that related to data loading is displayed in the Load Status page.
In the Pipeline Overview page, the following sections and tabs offer different information about the progress at both Pipeline and object level, as follows:
-
Important updates about your Pipeline: The Notification Bar provides you important updates about the Pipeline. For example, it alerts you when when all stages complete successfully and Events start loading to the Destination.
-
Progress of the data replication activity across different Pipeline stages: The Pipeline Progress Bar in the Pipeline Overview page provides a visual representation of the progress of the data replication process through various stages till data is finally loaded to the Destination. The progress is refreshed every 10 seconds.

Once Events start loading to the Destination:
-
For JDBC Destinations, the Explore Data option becomes available. You can use it to view the loaded data via the Destination Workbench.
-
For all the Sources, the Pipeline Activity graphs are displayed. These graphs are also displayed once the Log task is completed for log-based Pipelines.
The Progress Bar automatically disappears after one hour of all the stages becoming successful or 24 hours after Pipeline creation, whichever is sooner.
-
-
Data movement timeframes: The expected data movement timeframes are mentioned below each stage in the Pipeline Progress Bar. It lists the approximate time it will take for the stage to start, and the time it will take to finally load your data to the Destination. This estimate is based on historical averages for such data loads and the calculation of current loads.

The icons also indicate the current status of a stage. For example, a stage progressed correctly (tick-mark (
 ) icon), is waiting to start (hourglass (
 ) icon), or has any errors or warnings by looking at the icons.
Any warnings and errors are displayed below the stage name. Read Troubleshooting Data Replication Errors.
) icon), or has any errors or warnings by looking at the icons.
Any warnings and errors are displayed below the stage name. Read Troubleshooting Data Replication Errors. -
Historical load progress, for log-based Pipelines.
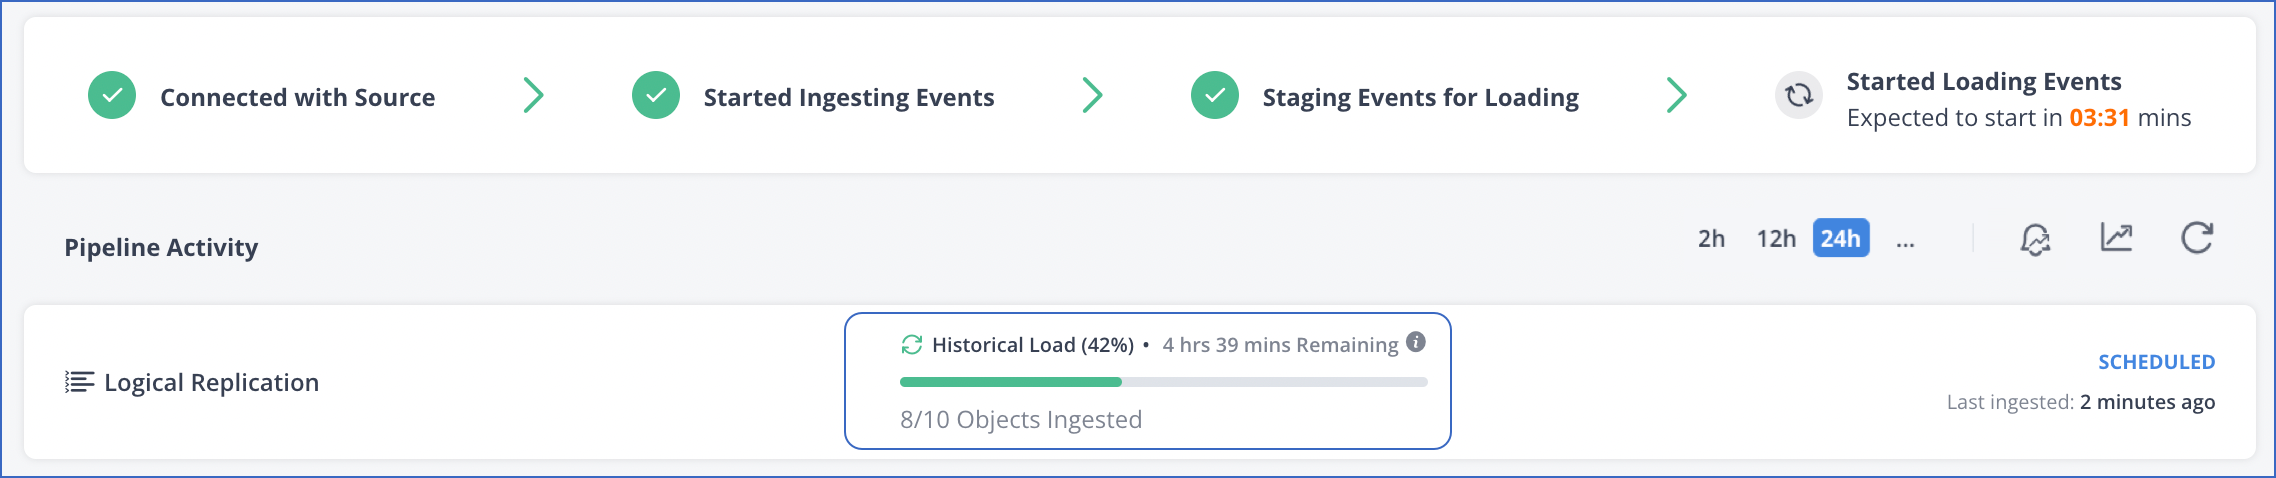
The Historical Data Load Progress Bar is displayed when Hevo starts loading data to the Destination. Historical load progress is represented as the percentage of active objects ingested out of the total active objects. In the Pipeline Overview page, under the Pipeline Activity section, the progress bar displays the progress percentage, remaining time for historical data ingestion, the status of objects being ingested, and the last updated time of objects. Let us say, there are four objects (Event Types) in total and the current historical load progress is 50%. This means that two out of the four objects are ingested successfully. This progress changes to 75% and then to 100% respectively, as the third and fourth objects are ingested. The % completion does not relate to the number of Events ingested from any Event Type.
This feature is currently available for MySQL and PostgreSQL only.
-
Event count across the different stages: Once the Events start loading to the Destination, the Pipeline Activity bar provides you information such as the number of Events ingested and loaded or any latency experienced during this process.

For each stage, it displays:
-
The number of Events processed in that stage.
-
The Pipeline Activity graph, where each bar of the graph represents the number of Events processed in each run of the Pipeline.
-
The average throughput, indicated as the number of Events processed per minute.
-
Viewing Object-level Progress
You can view the ingestion and loading progress of your Pipeline at the object-level and Destination table-level, respectively in the Pipelines Detailed View. The following sections describe the information provided by Hevo for ingestion and loading.
Data ingestion progress
The data ingestion progress of a Pipeline can be viewed through the Pipeline Objects section. This section provides a snapshot of the Events ingested for every object, along with the count of any failed Events. Read Managing Objects in Pipelines.
Data loading progress
You can check progress of the data loading stage by using the Load Status page in the Pipelines Detailed View. This page provides a snapshot of the Events loaded by the Pipeline to the corresponding tables in the Destination. Each row in the page provides the following information about a Destination table:

-
Name of the Destination table
-
Events Loaded: Total count of Events loaded to the Destination table, and a Load graph to display Events loaded at different points in time.
-
Events Pending: Number of Events ingested but not yet loaded to the Destination
-
Latency: Delay between Events being ingested and loaded to the Destination
-
Load Status of the table
Note: You can use the Destinations Detailed View to check the overall data loading status for all the Pipelines using that Destination.
To access the Load Status page:
-
Click PIPELINES in the Navigation Bar.
-
In the Pipelines List View, click on the Pipeline for which you want to check loading progress.
-
In the Tools Bar, click the Load Status (
 ) icon.
See Also
Revision History
Refer to the following table for the list of key updates made to this page:
| Date | Release | Description of Change |
|---|---|---|
| Sep-07-2022 | 1.97 | Updated the Viewing Pipeline-level Progress section to add information about the historical data load progress bar. |
| Mar-21-2022 | NA | Reorganized the page to present information more intuitively. - Added sections, Viewing Pipeline-level Progress and Viewing Object-level Progress. - Renamed and moved section, Troubleshooting Data Loading Errors to a new page. |
| Feb-07-2022 | 1.81 | Added section, Pipeline Activity Graphs to inform users about the graphs present in the Pipeline overview page. |
| Nov-09-2021 | 1.75 | Added the section, Historical Load Progress. |